Monday, December 31, 2012

Customer Tips: Roundup Edition

Here are a few extra tips for a roundup edition of our Customer Tips series to get your new year off to a good start!


Sometimes it's helpful in an analysis to recode variables, like recoding a binary variable for retention to a binary variable for attrition. 
- Jean Constable, Director of Institutional Research at Texas Lutheran University

Problem: a new input file every two weeks needs to be processed by the same job time after time.
Solution: Use a generic file name for the file in the input node. Copy the weekly input file to the generic file name and run the job. This works as long as the input files have an identical format. 
- William Anderson, CIO at Saint Michael's College

If you throw a filter between your input and the merge even if not populated when you change the input file, you do not lose the merge connections or fields!
-Loralyn Taylor, Registrar Director of Institutional Research at Paul Smith's College

Wednesday, December 19, 2012

Rapid Insight's Holiday Wishlist


As the holiday season is in full swing, we at Rapid Insight have taken the opportunity to put together a wishlist of things we’d like to see more of in the future.


We’re envisioning a world where…

…there are no hidden network firewalls – and no need for them.  – Jeff Fleischer, Director of Client Operations

...we get to eat more Lindt chocolate. – Tricia Mills, Account Management Team

…our customers have the budget to purchase the tools and hire the staff to properly serve their student population.  – John Paiva, Account Management Team

…nobody is burdened with clunky tools like SAS and SPSS. – Mike Laracy, President and CEO

…data comes perfectly cleansed and ready for model building. – Caitlin Garrett, Statistical Analyst

…data analysts are fearless in their pursuit of using data to drive good decisions. –Sheryl Kovalik, Director of Operations and Business Development

…more people re using Rapid Insight. – Chris Major, Sales Team

…there’s more candy! – Julie Crawford, Account Management Team


Now that you have our wishlist, we'd love to know: what's on yours?

Wednesday, December 12, 2012

Thoughts from a Reporting Wiz

Scott Alessandro of the MIT Sloan School of Management is a lover of ad-hoc reporting and coffee ice cream.  In anticipation of his webinar on Friday, we asked him a few quick questions about his day-to-day analytic life. 

CG - What types of analytic requests do you handle?

SA - Some ad-hoc requests and some internal reports for my office, including degree requirement completion, grade distribution reports, enrollments by programs, GPA comparisons among courses or programs, impact of student population on enrollment/availability, etc. 

CG - What is your typical response time?

SA - Much faster now [with Veera] than beforehand. In the past, it would take me at least a couple of hours of unbroken time to create a report - which means a while. With Veera, unbroken time doesn't make a bit of difference. 

CG - Have you seen your decision-making become more data-driven with Veera?

SA- Most definitely. I hoped that it was always data-driven, but now because I have such easy access to data, it allows me to answer more questions, or anticipate more questions. 

CG - What do you hope attendees will take away from your webinar?

SA - That we have a lot of data and the problem was not having the time to use it or go through it. That's what Veera allows us to do. Since it's a visual tool, it becomes that much more accessible for people who are not as data-inclined. 

CG - Anything else you'd like to add?

SA - When I have Veera on at home, even my kids are impressed. It looks really neat. There's something artistic about it and that's why I like it. 

*

We are pleased to present Scott's webinar, From Data to Decisions: Ad Hoc Analytics and Reporting with Rapid Insight Veera, on how he is utilizing Veera efficiently to respond to the wide range of analytic demands confronting him daily. The webinar will take place on Friday, December 14th from 11am - 12pm EST. 

For more information about Scott's webinar, or to register, click here

For more information about Scott, read on:


Scott Alessandro is the Associate Director of Educational Services at MIT Sloan School of Management. His main responsibilities entail overseeing the Registration Team, managing MIT Sloan’s course bidding system, and reacting to various data requests. In previous lives, he has worked at Boston University (running summer pre-college programs), Temple University (in the Honors Program and the Undergraduate Admissions Office), and the College Board (coordinating AP workshops and data reporting). All of his jobs have combined numbers and people, which has made Scott quantifiably and qualitatively happy. Outside of work, Scott satisfies his curiosity and finds entertainment in hiking, woodworking, playing sports, watching sports (though has not found as much happiness lately rooting for the Chicago Bears and New York Mets), and trying to stay one step ahead of his two young children. 


Tuesday, December 11, 2012

Five Data Preparation Mistakes (and How to Avoid Them!)

After building many predictive models in the Rapid Insight office and helping our customer build many more models outside of the office, we have a list of data preparation mistakes that could fill a room. Here are some of the most common ones we've seen:


1. Including ID Fields as Predictors
Because most IDs look like continuous integers (and older IDs are typically smaller), it is possible that they may make their way into the model as a predictive variables. Be sure to exclude them as early on in the process as possible to avoid any confusion while building your model.

2. Using Anachronistic Variables
Make sure that no predictor variables contain information about the outcome. Because models are built using historical data, it is possible that some of the variables you have accessible when building your model were not available at the time the model is built to reflect. No predictor variables should be proxies for your dependent variable (ie: “made a gift” = donor, “deposited” = enrolled).

3. Allowing Duplicate Records
Don’t include duplicates in a model file. Including just two records per person gives that person twice as much predictive power. To make sure that each person’s influence counts equally, only one record per person or action being modeled should be included. It never hurts to dedupe your model file before you start building a predictive model. 

4. Modeling on Too Small of a Population
Double-check your population size. A good goal to shoot for in a modeling dataset is at least 1,000 records spanning three years. Including at least three years helps to account for any year-to-year fluctuations in your dataset. The larger your population size is, the most robust your model will be. 

5. Not Accounting for Outliers and/or Missing Values
Be sure to account for any outliers and/or missing values. Large rifts in individual variables can add up when you’re combining those variables to build a predictive model. Checking the minimum and maximum values for each variable can be a quick way to spot any records that are out of the usual realm. 

[photo credit]

-Caitlin Garrett, Statistical Analyst at Rapid Insight

Thursday, December 6, 2012

Guide to Rapid Insight Resources


Networking:
We have created several opportunities for networking with other Rapid Insight users, including a Rapid Insight LinkedIn customers-only group, and several more subject-specific subgroups.


Webinars:
Check out our list of upcoming webinars here. These are a few you might want to check out:

Predictive Modeling (PM) for Higher Ed ** PM for Fundraising
Dashboards and Reporting for Higher Ed ** PM for Healthcare 

Training Resources:


Blog:
Here are links to a couple of recently featured series:
  • Customer Tips: tips from customers on ways to make your life easier.
  • Creating Variables: on how any why to augment your dataset by creating additional variables using Veera.
  • The Forgotten Tabs: on the benefits of utilizing some of Analytics’ lesser talked about tabs.


Conference:
Rapid Insight is proud to host an annual User Conference each summer. Information about the conference will be available on our User Conference page as the conference draws near. 

If you have any additional questions about Rapid Insight resources or products, please feel free to contact me directly at caitlin.garrett@rapidinsightinc.com

-Caitlin Garrett, Statistical Analyst


Tuesday, December 4, 2012

On Automated Mining


One of the things I love the most about using statistical modeling software (especially Analytics) is that so much of the process is automated. Although automation has made the lives of statisticians much easier (calculating individual standard errors by hand would take hours for each variable), it is still important to be familiar with the methods and thinking that go into the variable selection process. One tab that does a lot of statistical heavy lifting for us is the Automated Mining tab, and I thought it would be good to explore some of the tests that are being used in that tab.

The function of the Automated Mining tab is to determine, variable by variable, which variables are statistically related to the selected y-variable, and which are not. The statistical test will vary from pair to pair depending on the types of variables being compared. One thing that is important to note is that we’re not doing any modeling or looking at the relationships between x-variables yet. The Automated Mining tab and its tests are only deciding which variables have the possibility of being in the predictive model, not which ones will be.

Depending on the types of x- and y-variables involved, one of three tests will be used to decide how related each variable pair is. These possibilities include a Chi-Square test, a Z-test, or an F-test. 


Variable Under Evaluation

Y-Variable
Binary
Continuous
Categorical
Binary
Z-Test
Decile-Chi-Square
Z-Test
Continuous
Z-Test
Decile-F-Test/ANOVA
Z-Test
Categorical
n/a
n/a
n/a

Chi-Square Test
A chi-square test is performed for any continuous x-variables used to predict a binary y-variable. In our Automated Mining tab, this test is performed on each of 10 deciles to determine whether or not the ‘ones’ are randomly distributed across the deciles. This test is more robust than using a linear correlation, as it captures non-linear relationships as well as relationships that are not well fit by a curve or line.

Z-Test
A Z-test is used for any binary or categorical predictors, regardless of the type of y-variable they’re trying to predict. It tests whether any category is significantly different in terms of the Y (relative to all other categories).

F-Test
An F-test is used whenever you have a continuous x-variable trying to predict for a continuous y-variable. In our Automated Mining tab, the data is sorted into deciles and an ANOVA test is run on these deciles to determine if the means are statistically different. This is more robust than a linear correlation, as it captures non-linear relationships and those that do not fit a standard curve.

Once each of these tests is performed at the specified level of significance, we have a narrowed-down dataset of only variables that are statistically related to our y-variable, which brings us one step closer to figuring out which variables historically have the most influence on our y-variable and will end up in our final predictive model. 

-Caitlin Garrett, Statistical Analyst at Rapid Insight 


Tuesday, November 27, 2012

Customer Tips From... Jeff Fleischer (Rapid Insight Inc.)

Okay, okay... Those of you who have worked with Jeff know that he isn't really a customer. But, as the Director of Client Operations here at Rapid Insight and an analyst at heart, he is a wealth of information, so I've decided to share some of his tips. They are:

1. The Format Column node was retired a few releases back in favor of the Convert node. Using Convert, change the data type you wish to format to "text", then select the desired style from the node's Format column. PS: The Format Column node is still accessible - try going through the menu Node -> Add Report -> Format Data. 

2. Merge nodes will forget their setup if you disconnect them from their inputs. Placing a Cache node just before the Merge will keep it from forgetting its configuration if you need to relocate or copy it. 

3. Merge nodes also act as a rename. Just edit the text in the Output Column and use the black arrows on the menu bar to rearrange the column order. Bonus tip: select multiple columns before using the black arrows to re-position several at a time. 

4. Use the menu option Edit -> Convert All Columns to Text to do just that. 

5. Dropdown box controls often respond to single letter entries, avoiding actually having to pick from the dropdown list.

6. Select multiple fields using Ctrl-LMouse to Cleanse multiple fields by setting up a single rule/operation. Note that the fields all have to be of the same type (text, integer, date, etc.) for this to work. 

7. Use the new "File Created Column" option in a Combine Inputs node to identify (with a Filter or Dedup) the most recent records coming from a location. 

Tuesday, November 20, 2012

How to Score a Dataset Using Analytics Only

Since we’ve already covered how to score a dataset using Veera, it’s only fair that we show you how to score using the Analytics Scoring program. We’ll start at the point where you save your scoring model within Analytics. After memorizing your model in the Model tab, you’ll want to move down to the Compare Models tab. This tab allows you to compare any two models side-by-side. Once you’ve decided which model you like better, you’re ready to save it by selecting the model and clicking the “Save Scoring Model” as button, as shown below.


Analytics will prompt you to navigate to where you’d like the file to be saved, and will save it with a .rism (Rapid Insight Scoring Model) extension. After saving the .rism file, you’ll want to open the Analytics Scoring Module by going to your Start Menu and navigating to Rapid Insight Inc. -> Analytics -> Scoring, as shown below. 


Once inside the scoring module, you’ll need to click the “Select Dataset” button and navigate to where the dataset you’d like to score is located on your machine. After loading in your dataset, you’ll see all of the variables within it populate the ‘Dataset Variables’ window. Next, you’ll need to click the “Select Scoring Model” button and navigate to where the scoring model (.rism) file you’d like to use is located. Once you find the model, its equation will show up in the corresponding window.


Before you start the scoring process, you have a couple of options detailing how you’d like the model to be scored. The first option, shown above in the green box, allows you to validate the model by looking at the decile analysis resulting from the scoring process. The second option, shown in the blue box, allows you to output the scores as well as the corresponding deciles or percentiles. After you’ve selected the appropriate options, click on the “Start Scoring” button, decide where you’d like your scores to output, and Analytics will score your dataset in the way that you request. 

-Caitlin Garrett, Statistical Analyst at Rapid Insight

Tuesday, November 13, 2012

Predictive Modeling Mantras

Whether you're new to predictive modeling, or you dream in decile analyses, here are some things to keep in mind as you're embarking on your next modeling project: 


Data preparation makes ALL the difference.
Simply put, if you use junk data to create a model, chances are that your model’s output will be junk too. Thus, it’s very important to clean up your data before building your predictive model. During the data clean-up process, you’ll want to think about things like how to handle any missing values, possibilities for new variables to be added to your dataset, how to handle outliers, and make sure that your data is as error-free as possible.

A complex model isn’t the same as a good model.
More often than not, the best model is a simple one. Although you can almost always find a new variable to add, or new way to slice your data, you want to avoid the trap of overfitting. You want your model to be specific, but not so specific that you sacrifice reliability when scoring a new dataset.

A good model validates what you know while revealing what you don’t .
Don’t be surprised if some of your “common sense” variables outperform the more exotic ones. Although it’s always nice to pick up on some new variables and insights, building a predictive model can also boost your confidence in the rest of your data.  

If a model looks perfect, it’s lying.
As exciting as getting a great model fit statistic can be, there is the possibility of too good to be true when it comes to model building. If you build a particularly great model, you’ll want to double and triple check each of the variables in the model to be sure they make sense. One of the most common reasons for a great model is an anachronistic variable – a variable you would have available only after your y-outcome was decided.

Persistence is a virtue (because building models is an iterative process).
After you’ve taken a first pass at a model, maybe you’ll think of a related variable that would be predictive. Maybe you take a second look at some of the relationships between variables and decide to bin or re-map some of your continuous or categorical variables. Maybe the outputted variables are the opposite of what you expected, so you decide to tweak the way your dataset is set up. The point here is that your first model will likely not be your final model. Be ready.

Trust and verify.
The modeling process doesn’t end after you finish building your model. After implementing your predictive model, you want to be sure that it’s correctly predicting your y-variable over time. To do this, you’ll need to compare your model scores with actual results once they are available. If your model is correctly predicting the desired outcome, you can continue to use it (but still must validate as time goes by); otherwise, you’ll need to take a few steps back to see where you can make improvements.


-Caitlin Garrett, Statistical Analyst at Rapid Insight
[photo credit]

Wednesday, November 7, 2012

Subroutines (Customer Post by Tony Parandi)


Today's blog entry comes from Tony Parandi, Assistant Director of Institutional Research at Indiana Wesleyan University: 

One feature of Veera that I’ve found very helpful is the Subroutine node. This node allows you to feed the output of another job directly into the job you’re currently working on. In essence, it allows you to put a job within a job. This is especially helpful if you have a certain data stream that you commonly use, and do not want to rebuild it each time you need it.

An example that I commonly use the Subroutine node for is the recoding of student ethnicity. In 2010, when the Department of Education mandated the new ethnicity categories, we added two additional ethnicity/race fields to our data system (Datatel). Thus, students could have a wide myriad of ethnic category combinations, which means we have to reform these combinations to match the IPEDS definitions. In order to accomplish this I bring in the ethnic data from our warehouse, and use a series of transform nodes to convert the three ethnicity fields into one final ethnic category:

Rather than recreate this stream for every job, I have it saved as a separate job, called “Ethnic Conversion”. As you can see in the picture above, the Output Proxy node is necessary when creating a job for Subroutine purposes as it connects the output data to the Subroutine to the other job you’re building.

Now when I create a new job that needs ethnicity reformatting, I simply bring in a Subroutine node and connect to my data via Student ID in the Merge node.

The output gives me a single ethnic category that matches IPEDS for every student, based on data brought in via the Subroutine.

Although this is a small and simple example of a Subroutine job, the node is a powerful way to connect jobs without having to do copy/pasting or rebuilding. I have found the Subroutine node to be a great time saver, and I encourage everyone to use it whenever possible.

PS: Be sure to check out the rest of our customer tips series here!

Friday, November 2, 2012

NEAIR Presentation: "Four Years of Predictive Modeling and Lessons Learned"

Be sure to catch Dr. Michael Johnson, Director of Institutional Research at Dickinson College,  presenting "Four Years of Predictive Modeling and Lessons Learned" at this year's NEAIR Conference. 


Dr.  Johnson will present an overview of his predictive modeling journey over the past 4 years.  Sharing the many lessons learned, he will outline the various ways predictive modeling has become integrated into the college’s data driven decision making as well as reviewing how the Rapid Insight products and analytic expertise have played an integral role in that process.

The presentation will take place on Monday, November 5th from 2:30 - 3:15 in the Embassy Room. 

Wednesday, October 31, 2012

Customer Tips From... Brian Johnson (DonorBureau)

Today's installment in our customer tips series comes from Brian Johnson, the VP of Product and Operations at DonorBureau. Here are his tips: 

1. You can have multiple select statements in the Query node as only the last statement does not have a temp table statement. This has allowed me to automate any complicated SQL queries I have for reports to run every week. 

2. If you need to create a new version of a scheduled report, use the old version and it will inherit the schedule of the original report in terms of run times. 

3. You can save output to Dropbox or Google drive to distribute data to team members without having to fill up their inbox. 

Wednesday, October 24, 2012

How to Score a Dataset Using Veera


After you’ve ‘memorized’ the predictive model you’d like to use, you’re ready to start the scoring process. There are actually two ways to score a dataset using the Rapid Insight software suite. In this post, we’ll talk about how to import your scoring model into Veera and quickly score your dataset.

We’ll start at the point where you save your scoring model within Analytics. After memorizing your model in the Model tab, you’ll want to move down to the Compare Models tab. This tab allows you to compare any two models side-by-side. Once you’ve decided which model you like better, you’re ready to save it by selecting the model and clicking the “Save Scoring Model” as button, as shown below.


Analytics will prompt you to navigate to where you’d like the file to be saved, and will save it with a .rism (Rapid Insight Scoring Model) extension. Once you’ve saved the file, you’re ready to move into Veera to score your dataset.

In Veera, you’ll want to create a new job for scoring. In that job, bring in your input file (the file you’d like to score), and connect it to an output files. When configuring the output file, you can choose to write your scores to a file, spreadsheet, or back to a database table. Once the input and output files are connected, you’ll be importing the scoring model between them. To do so, right-click on the line connecting the two files and select Wizard -> Import Scoring Model, as shown below:


You will need to navigate to where you saved your scoring (.rism) file and select it to finish the import. Once you’ve done so, you’ll see four or five new nodes populate on the line between your input and output file. These nodes, shown below, are Analytics’ way of communicating the scoring process to Veera.


One very important thing about this scoring process is that your model is not a black-box model – you can explore each step to see how your data is scored. Feel free to open each of the nodes and see what they are accomplishing. If you open the “Create New Variables” node, you’ll be able to see any of the transformations used in your predictive model; you can also access the model formula itself by opening the “Calculate Probability” node. To get the probability scores, go ahead and run your job. The scores will be outputted as a new column called “Probability” in your output file or database. 

-Caitlin Garrett, Statistical Analyst at Rapid Insight

Wednesday, October 17, 2012

Customer Tips From... Dr. Nelle Moffett (California State University - Channel Islands)

The next installment in our customer tips series comes from Dr. Nelle Moffett, Director of Institutional Research at Cal State - Channel Islands. Nelle is an avid Veera user and loves building analytic processes. Here are her tips:

  • Use a Rename node before an output to select only the fields that you want and re-sort them in the desired sequence.
  • Use the Cleanse node liberally before any Transform node to remove or replace missing data. This will eliminate unexpected results when the Transform node encounters missing data. 
  • To create your own variable labels, create a look-up table in Excel with the original values and the new value labels. Then merge this file with the original file using the field labeled "original" and keep the new field with the desired value labels. 
    • Example of value file:
  • To calculate the percent of a certain characteristic in the dataset, first use a Transform node to set a flag for that characteristic where 1= has the characteristic and 0= does not have the characteristic. Then use an Aggregate node and select the mean for a flag.
     
  • To update a job to the current form of a dataset, first make the connection to the updated dataset. Then double-click on the data node in the job. At the bottom of the window where it says "connection" click on the name of the data file and select the new version. make sure all of the data fields are checked (that should be) and save the changes. If you give the data node a generic (rather than dated) name, then it will still be appropriate as the data continues to be updated to the current date. 
...Have tips of your own? Email them to caitlin.garrett@rapidinsightinc.com!

Tuesday, October 16, 2012

Fall Pricing Promotion

For both new and existing customers - now until November 16th!

Not a customer yet? Rapid Insight is offering 10% off your software purchase through November 16th, 2012. 

Already feeling the love? We're offering existing customers the "add a license" promotion: add a license of either Rapid Insight Analytics or Veera for only $3,000 each. 


We hope this is what you've been waiting for!


For more information, please contact Sheryl Kovalik at 
sheryl.kovalik@rapidinsightinc.com or (603) 447-0240 ext. 7568

Wednesday, October 10, 2012

Creating Variables: Fiscal Year


                For those of you whose fiscal year is different from the calendar year, having a Fiscal Year variable can be a huge timesaver, which is why we've chosen it as the next entry in our Creating Variables series. Filtering and sorting on this variable make it easy to compare things like gifts on a fiscal year to fiscal year basis, as well as easily focus on one or more years of interest. Fortunately, creating this variable is easy by following these steps in Veera:

The first step is to hook your dataset to a transform node:


Once in the transform, select the date variable (in the form DD/MM/YY) you’d like to extract fiscal year from. Next, click on the “IF” button (the top button on the right-hand side) to generate an ‘if’ equation. In the Enter A Formula window, we’ll want to edit the auto-generated equation so it reads:

IF(month(A)>=7,year(A)+1,year(A))

where A is the date field that you’re extracting fiscal year from. This example is assuming a July 1 fiscal year start, which is why we used the number 7 (feel free to edit accordingly). Be sure to name the new variable and select “text” from the Result Type list before saving.


The formula is saying that if the month of the date field falls after the beginning of the new fiscal year, then set the fiscal year to the newer fiscal year (which is the year after A because the fiscal year will end in that next year). Otherwise, we’re setting the fiscal year equal to the year of the date field (because the fiscal year ends in that year).

Finito!

-Caitlin Garrett, Statistical Analyst at Rapid Insight

Friday, October 5, 2012

Fundraising: The Science


Now that we’ve discussed the art of fundraising, I think it’s only right that we focus a little bit on the science. After all, knowing which prospects are statistically most likely to give makes a gift officer’s contribution to the art of fundraising that much more successful. As I’ve mentioned before, my function in the fundraising spectrum is as an analyst, helping customers build models identifying which prospects are most likely to donate.

One of the most important things we do during the predictive modeling process is data preparation, which often means creating new variables from the data our customers have on-hand. I’d like to discuss some of these variables, as well as how and why to include them in a fundraising or advancement model. For the purposes of this blog entry, I’ll use a higher education example. Typically a higher education institution might have some extra variables, but these can be tailored to fit other institutions or excluded when not relevant.

Demographic Information          
It’s always smart to have an idea of what each donor looks like at a demographic level. Variables to include here are things like age, gender, marital status, and any occupational data you might have available to you. In a higher education context, this would also include things like the constituent’s class year, major, whether or not their spouse is an alumni, and whether they are a legacy alumni (meaning a parent or grandparent also attended the institution). Additionally, we often create a “reunion year flag” indicating if the analysis year is a reunion year for that person, as donors are often more likely to give (and give larger gifts) during a reunion year.

Location Information
General information about each donor’s location like ZIP code, city, and county can be useful as categorical variables (treating people that live in each one as a group). Once we have a ZIP code, we always calculate a “distance from institution” variable using one of Veera’s pre-programmed functions. This new variable, which is measured in miles, gives you a solid idea of the relationship between location and giving. If you have access to census data, we recommend appending variables relating to neighborhood or housing type. Creating flag variables for wealthy neighborhood ZIP codes can also be useful; constituents coming from these areas may be more likely to give. Although this can be created at a more local level, we often start with Forbes’ list of the top 500 wealthiest ZIP codes in the US, which is available online at http://www.forbes.com/lists/2011/7/zip-codes-11_rank.html.

Contact History
The ways in which a donor engages with you can tell you a lot about their likelihood of giving. For starters, include variables pertaining to their event history. How many events have they attended? Which types of events are they attending? How many days since their last event? Answers to questions like these can sometimes turn out to be predictive of giving. This is also where your social media variables come into play; create flags for whether a constituent is following you on LinkedIn, Facebook, Twitter, Pinterest, etc. A donor following you on one or more of these sites is an indication that they want to be connected, and therefore they may be more likely to give. Conversely, if a constituent has indicated that they do not want to be contacted, you’ll want to include this information as well, as it can be very predictive.

Gift History
This brings us to our last and most predictive set of variables: giving history. These variables should answer all kinds of questions about what a giver looks like historically, like:

  • How many gifts have they given in their lifetime?
  • What was their last gift?
  • How many days since their first gift? How many days since their last gift?
  • Have they given in the past 12 months? If so, how much?
  • What is the velocity of the gifts - are the increasing, decreasing, or staying the same?

One thing to note here is that gift dates themselves aren’t useful in a predictive model, but their translations – like the number of days since an event – allow us to use the insight they provide.

In building a predictive model, some of these variables may be predictive, while others might turn out not to be. It’s a good idea to include some combination of these variables, plus anything you have on-hand that you think could possibly be predictive.

-Caitlin Garrett, Statistical Analyst at Rapid Insight

Friday, September 28, 2012

Customer Tips From... Scott Alessandro (MIT - Sloan School of Management)

The third edition of our customer tips series is brought to you by Scott Alessandro, Associate Director of Sloan Educational Services at MIT's Sloan School of Management. Scott is a long-time and avid Veera user who has been very creative with his applications of the software. Here are his tips: 

1. You are able to remap your data files by clicking on the connection icon either under the connections menu or in the job on the actual file. When I first started using Veera, I was afraid to move files around as it would break connections. Now I know better.  


2. Use the Find DeDup or Remove Dup node when you are working with a data file for the first time. You will be surprised how often duplicate records exist in data files (well, really we should not be surprised, but sometimes are).

3. With the output node, you can check or uncheck the columns you want to include. This is especially useful when you are using transform or merge nodes. I like to keep all of the columns throughout my job and then only select out the relevant ones in the output node. Helps you to keep track of what you are doing within a job (especially also if you create a ‘test’ output you move around the job).

4. Use ‘Set Run Order’ when you have multiple outputs in a job or a job that relies on one output to run another output. Akin to that, in the Merge node, you can also change the order that files are merged together by right clicking on the file number. Since I like to merge a lot of different files together, it is useful to be able to change the merge order especially if you add files later. 


5. Right click on a job to make a copy and then paste it onto the workspace.

6. In Cleanse, can multi-select columns and run the same type of cleanse, rather than selecting each column individually. 
7. Use the Rename node to re-order columns.

...Have tips of your own? Email them to caitlin.garrett@rapidinsightinc.com!

Wednesday, September 19, 2012

Customer Tips From... Dan Wilson (Muskingum University)

Our next set of customer tips comes from Dan Wilson, Registrar at Muskingum University. Dan typically uses Veera for repetitive and/or complex reports, including multi-year enrollment history by date, historical majors and minors (by year and department), and IPEDS reporting. Here are his tips:

1. It is important to remember the merge characteristics (all from a, all from b, all from both, only matching, etc.) so the last thing I do in developing any report is to verify each of these. 

2. While Veera's CrossTab feature is quite useful, I find it easier and more familiar to output my results to a target excel file, and then have another excel spreadsheet with my pivot table that has all of the formatting and other features set up. That way I can update the data file without overwriting my formatted "results" file. The same can be done with separate sheets in a file, but some of my reporting files pull data from different queries and Veera reports. For those reports I can run data from several sources, then open up my main file and hit "refresh". 

3. For those instances when a transform looks like a computer program, I'll break it into smaller bits and spread it out over several nodes. This allows me to test smaller chunks of the function at a time and locate any errant code prior to needing valium. (Editor's note: using the de-bugger in the Transform node can also help to find errors quickly!)

...Have tips of your own? Email them to caitlin.garrett@rapidinsightinc.com!

Wednesday, September 12, 2012

Fundraising: The Art


As much as my analytic brain would love to be able to classify the world into black and white binaries, sometimes this division is 
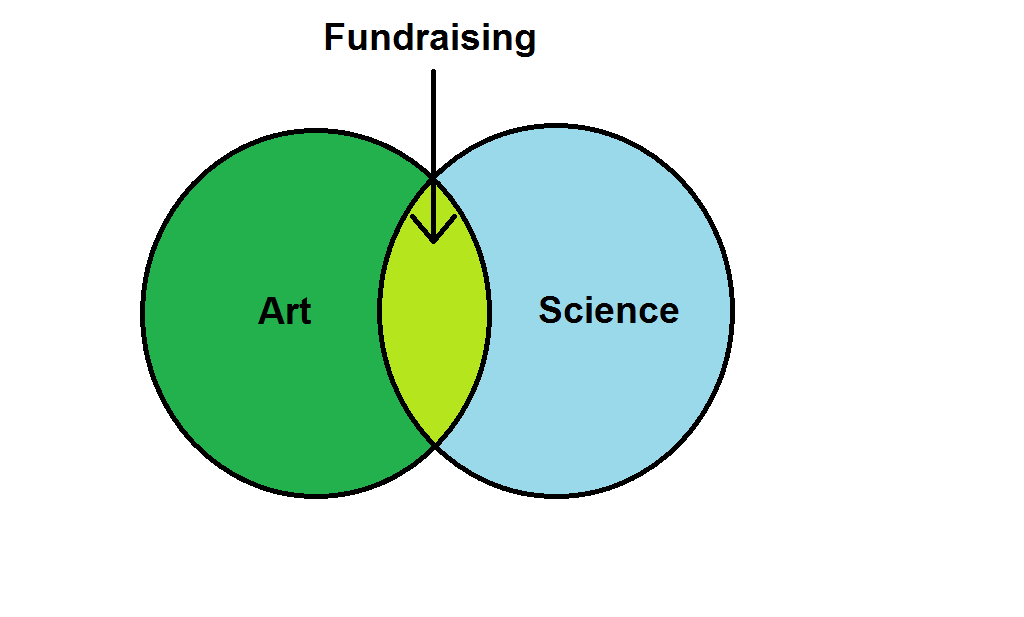
just not possible. Such is the case with fundraising. As important as prospect and donor research are, just knowing which prospects are statistically most likely to give to your institution does not mean that they will automatically give the amount you predict, when you predict it. Other factors, such as the relationship between the donor and institution and the way in which appeals and touches are made, have a heavy impact on how much and how often a donor chooses to give. My personal role in the fundraising spectrum has been on the analytics side, helping customers build models identifying which prospects are most likely to donate. This August, I was given an opportunity to learn about the other half of the process during APRA’s Data Analytics Symposium.

The thing that resonated most with me was Penelope Burk’s tenets of donor-centered fundraising. She says that donors want:

I. Prompt and meaningful acknowledgement for their gift(s);
II. To know specifically where the money will go;
III. To be updated on the progress of projects they donate to.

Let’s look at these in a little more detail, shall we?

Donors want to be thanked soon after their gift is received.  This thank you should be personalized and delivered in a way that’s meaningful to the contributor.

Donors want to know which fund, building, scholarship, or project their money will be used for. Allocating donor dollars to a specific project is helpful both for the donor and the institution they are donating to; for example, when a gift officer is touching base with the donor, they can focus on project-specific updates, rather than simply speaking to the value of the institution overall.

Donors like being updated on the projects they’ve donated to. They want to know how far along a project is, an expected completion date, and when the project hits major milestones. The key here is communication. The more you communicate with a donor, the more involved and appreciated they feel, and the more likely they are to give again. Most of all, donors want to be sure that their money is making a difference.

One of the reasons that donor-centered fundraising has become so important is that the climate of fundraising is changing. Rather than giving smaller dollar amounts to a wide variety of institutions, donors are trending towards whittling down the number of different institutions, but increasing the dollar amounts given to each. For this reason, it is important to acknowledge and update each individual donor to cultivate gifts.

I think one key take-away message of donor-centered fundraising is exactly that: it’s donor-centered. The communication between fundraiser and donor should be keyed in to the needs and expectations of the donor on an individual level. Secondly, there should be lots of communication (especially in the form of updates) between these two parties. If all of the above criteria are met, the donor should have a good feeling about their gifts, feel appreciated for giving, and continue to give. 

-Caitlin Garrett, Statistical Analyst at Rapid Insight

Wednesday, September 5, 2012

Customer Tips From... Dr. Loralyn Taylor (Paul Smith's College)


Our new customer tips series will feature tips from customers on using either of our software applications. Each entry will focus on one customer’s ideas to make your lives easier.

We’re kicking things off with Dr. Loralyn Taylor, from Paul Smith’s College. Dr. Taylor is a one-woman IR office and Registrar and is constantly looking for ways to save time when creating reports and executing jobs. Here are her five tips:
  1.  Take the time to rename your nodes so that you can easily follow your line of thought as you move through the job.
  2. Remember that there are multiple ways of doing things. The shortest is not always the best – to me it is often more important to be able to easily follow my thought on how I am working through the problem than to do it elegantly in the fewest number of nodes.
  3. Common problems to check for: data format incompatibility (just use a convert node), and sometimes a null is not actually a null (just because something looks blank doesn’t mean that it is).
  4. Remember that creating a job is like solving a puzzle; you have to think about it and play with it.
  5. I often have to run jobs many times to get them right. Helpful tip: Set up a test data output that you can move around to different parts of the job to see how your data is coming through at different points when you are troubleshooting. 

...Have tips of your own? Email them to caitlin.garrett@rapidinsightinc.com!