Monday, July 30, 2012

Introducing the Rapid Insight Collaborative Cloud


With the new version 4.1 of Veera comes the Rapid Insight Collaborative Cloud. The Collaborative Cloud allows Veera users to share and collaborate on any analytic processes that they develop; these processes can be utilized, discussed, and enhanced by anyone in the RI user community. We hope that the cloud will increase efficiency by allowing users to share resources and ideas in real time and draw upon the knowledge of their peers whenever they begin a new analytic challenge.

Accessing the Cloud
To access the Collaborative Cloud, click on ‘RI CC’ on the title bar and select “Browse RI Collaborative Cloud” as shown: 


Downloading from the Cloud
Once in the cloud, you have the ability to search for Veera jobs, transform operations, and chart styles to download.  You can choose to search these by contributor. You also have the ability to order search results by contribution date or type, number of downloads, number of comments, name, date modified, or contributor.


To get details on an item or select an item to download, simply double-click on its title. To view or leave comments, double-click on the “# Comments’ field.

If you choose to download a transform operation or chart style, Veera will direct you to save to a folder outside of the Veera program, similar to the way you would save any outputs from Veera jobs. If you choose to download a job from the Collaborative Cloud, Veera will place that job in an automatically created folder titled ‘From RI Collaborative Cloud’, which you’ll see along with your other folders in the Workspace tab:
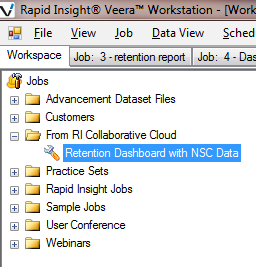

You can access any of the jobs you download from the cloud by navigating to this folder. 


Uploading to the Cloud
Right-click on the item to be uploaded (job, transform, chart style, or add-in) and select “Contribute [item type] to RI Collaborative Cloud”. Once selected, the Contribute to Rapid Insight Collaborative Cloud window will open with the original name of the item entered already at the top. 


Before submitting by clicking “Contribute”, the user must enter a unique name, a description of the item, and check the Terms & Conditions box before the item can be contributed. Additional files (like related sample data) can also be contributed as part of the submission.


Other Ways to Download
You can quickly download jobs from the Collaborative Cloud by right-clicking in the “Jobs” area of the Workspace tab and selecting “Get Job from RI Collaborative Cloud”:


You can also import transforms from within a Transform node. To do so, right-click on the white area in the “Transform Operations” window at the bottom of the screen and select ‘Get transform from RI Collaborative Cloud”.


To import a chart style from within the Chart Data node, click on the ellipsis to the right of the “Chart Style” drop-down menu. In that window, right-click and select “Get style from RI Collaborative Cloud” as shown below. 


-Caitlin Garrett, Statistical Analyst at Rapid Insight

Tuesday, July 24, 2012

Updated Features in Veera 4.1


The new and improved version 4.1 of Veera has quite a few updates. Here are 12 of the biggest changes you'll see when you update your version:

1. Transforms can now be saved for future use. If you have a useful formula or transform that you’d like to save to apply to multiple datasets, this means you can save the whole transform and export from or import into other jobs as needed.

2. Cache node now has a ‘view data’ option. So, once a cache is full, you can see what the data looks like at that point in a job, rather than having to check it out an output.

3. When using a Combine Input node, you can now create a “file date created” column and a “file modified column” to better track the dates associated with each of the files you’re importing.

4. Job and data view windows can now be un-docked and float outside of the main Veera window.

5. Sampling node now has ‘range’ option. Instead of having to sample records from the top or bottom of a dataset (if you didn’t want to sample randomly), you can now choose which range of records you’d like to sample from.

6. Sampling node is also parameterized. You can set a parameter to prompt you for the number of records to sample in each sample node.

7. When restoring connections, Veera will now Auto-backup in case anything was to go wrong with the restoration process.

8. A “busy” window will now show when Veera Client is connecting with the server.

9. Setting run order can now be done from a list rather than having to click on each output in the order you’d like them to run.

10. The Quantile node now allows you to choose whether to sort values in a descending or ascending order.

11. Fields on an Excel Output file can now be parameterized. So, if you’re running jobs with a particular parameter, this parameter can now be included as part of the outputted field names.

12. The new Variable Reduction node has now been implemented. When available, Variable Reduction will filter down the variables in your dataset so that you’re only looking at variables that are statistically significantly related to your chosen Y-variable from that point forward. 

...As always, we update our packages based on our customers' ideas and needs. If you have any feedback or ideas regarding either of our packages, we encourage you to leave them in the comments or email us directly. We'll make sure your ideas find their way to the right person.  


-Caitlin Garrett, Statistical Analyst

Friday, July 20, 2012

The Forgotten Tabs: Means Analysis


Continuing with the Forgotten Tabs series, the next tab we’ll be focusing on is the Means Analysis tab. The Means Analysis tab provides the mean, number of observations, maximum values, and minimum values for any of the variables in your dataset. You also have the option to take “means by” and “subclass by” to view the means of multiple subcategories across variable combinations.

 In this case, we’re comparing the attrition rates of legacy and non-legacy students by whether or not they received financial aid. For each of these four possible categories, we are able to see the mean attrition rate, the number of observations, and the min and max values. Doing so allows us to see the differences in attrition rate over a couple of different characteristics.

The Means Analysis tab can be also useful in comparing data from different cohorts or years in order to spot trends. In the example below, we’re comparing attrition rates by year, which allows us to pick up on any trends or changes that are occurring from year to year. If for some reason we were noticing a year that had a much higher or lower attrition rate than the other years, this gives us the opportunity to pick up on that and investigate further as to why that might be. 


You might also note that beyond looking at ‘Attrition’, we are also looking at a variable called ‘Predicted Attrition’. This variable represents the predicted attrition probabilities that we’ve assigned to each student. In this case, we’ve grouped these values by year to get an idea of how well we’re predicting attrition for that year compared to the actual attrition rate. Comparing our predicted values to actual values gives us a sense of any weaknesses from year to year that our predictive model might have. If we do find any weakness in predictive ability, we have the opportunity to go back and further fine-tune our model in order to incorporate our findings. 

-Caitlin Garrett, Statistical Analyst at Rapid Insight

Friday, July 13, 2012

Networking with Rapid Insight


Last month we hosted a roundtable discussion with our fundraising and advancement customers who attended our annual User Conference. It was suggested at that meeting that our customers would like more opportunities to talk to one another to exchange feedback and ideas on the projects you’re working on. We agree! To that end, we’ve set up closed, LinkedIn Rapid Insight sub-groups to facilitate those discussions. And though we’d be happy to contribute to the process, we hope that you will take this as an opportunity to learn from each other.

We have set up three separate networks, and the direct links are here:


In order to access the LinkedIn page, you will need a LinkedIn account. If you don’t have one, you can sign up by going to linkedin.com/home and filling out the necessary fields before clicking the ‘Join Now’ button.

If you have any questions or suggestions regarding this new page, please feel free to leave a comment on this post. We hope you’ll find this to be a valuable resource and an easier way to access your peers. 

-Caitlin Garrett, Statistical Analyst

Friday, July 6, 2012

The Forgotten Tabs: Frequency Analysis


During this year’s User Conference, I gave a presentation called “Analytics: The Forgotten Tabs”, which I’ve decided to expand into a blog series. The purpose of this series will be to explain how and why to use four of the lesser-known tabs in Analytics – Frequency Analysis, Means Analysis, Correlation Analysis, and Profiling Analysis. Each entry will focus on one of these tabs and we’ll start with the Frequency Analysis tab.

The Frequency Analysis tab’s output is actually fairly simple; it gives you the frequency of occurrence for any binary or categorical variable. For a single variable, it will output counts and percentages for each value of that variable. It is also capable of creating two-way cross frequencies, which output raw numbers, as well as row, column, and total percentages. 


While Frequency Analysis isn’t actually performing any statistical test – its functions are simple summing and percentage operations – it is providing valuable information about the number and percentage of observations that fall into each sub-category of a binary or categorical variable. Using this tab gives you a quick by-the-numbers glance at variables like “Ethnicity” or “Department”, which allows you to instantaneously compare subcategories without doing any manual addition or division. This is particularly useful when you’re working with a variable such as “Department” that may have a lot of sub-categories.


One other little-known fact about the output from Frequency Analysis (and other tabs) is that you can save it to the Report Bar the same way you would a graph or chart. To do so, click on the ‘Reports’ section of the taskbar and select ‘Launch Report Bar’. 


The report bar will float over your analysis; you can save things to it by dragging the outputs you wish to save into the bar itself. Saving things to the report bar allows you to export them from Analytics in a few different ways. If you select the ‘PPoint’ option before clicking ‘Export’, Analytics will create a PowerPoint such that each of the graphs our outputs you saved will become their own slide in the presentation. The other option you have is to save the information you’re interested in to the Reports tab in Analytics (by selecting the ‘Report’ option on the Report Bar), which allows you to create custom reports within the program and export these reports as Word Documents to be used later on. In any case, there are a number of ways to take the information that you’re getting from Analytics and use it in a presentation or report down the line.  

-Caitlin Garrett, Statistical Analyst at Rapid Insight

Monday, July 2, 2012

User Conference Recap


It's been one week since our User Conference wrapped up, and we're happy to say that we set a new attendance record with this one. Thank you to all who attended, and for those who were not able to attend, here's what you missed:

  • We had some great presentations from customers and staff alike on topics such as "Effective Assessment and Accreditation Using Veera", "Dealing with Common Modeling Issues", "Using Veer to Compile Survey Data from Multiple Sources", "Pivoting Away from Excel", "Predictive Modeling as Proactive Retention Strategy", and "Automating IPEDS". Thanks again to all who presented. 
  • Some of the feedback we got indicated that our customers would like more opportunities to talk to one another and exchange ideas and feedback concerning projects they're working on. We agree! To that end, we've set up a few networking groups on LinkedIn organized by subject to facilitate those exchanges. The direct links to these networks, by department, are:
  • We got a lot of feedback about things that we can add to our products to make them work better for you. If you have anything to add - suggestions, enhancements, or things we can be doing better - please email me and I'll make sure your ideas get to the right person. 
  • At the end of the conference, Mike Laracy, our Founder, President, and CEO, talked a little bit about product enhancements and changes on the horizon. We will be detailing these more as they come out on our blog, but here are some of the most important changes:
    • We'll be adding a conditional stop in Veera so that you can choose to stop a job based on a condition you set (for example, if you don't find any matches in a merge).
    • You'll be able to un-dock data views and individual jobs in Veera so that you can work on dual screens and easily see both your data and jobs at the same time.
    • We'll be adding in a 'Variable Reduction' feature, which will filter your variable set down to just those variables which are predictive (similar to the Automated Mining tab in Analytics). This allows you to focus on a smaller dataset consisting of predictive variables only. 
    • We saved the best for last: one of the things we're most excited about is a users-only Veera Collaborative Cloud. Our users will be able to share jobs with each other by saving and downloading them to and from the cloud. So, if you have a report that you think other institutions would benefit from using, you'll be able to upload that report to share with them. Similarly, if there's a particular report or output that you're hoping to achieve, before creating it by hand, you can see if anyone else has already created a similar job. We hope that the Collaborative Cloud will allow all of our customers to be as efficient as possible, and that the exchange of ideas will compound the speed of growth for all of the institutions we work with. 
-Caitlin Garrett, Statistical Analyst at Rapid Insight