Tuesday, June 25, 2013

Data Scientists: The Next Generation

As I’m sure you all have noticed, the data business is booming right now. (Are you tired of the term “big data” yet?) The fact that 90% of the data in world today has been created in the last two years is a great example of the growth trajectory of data. All of this data provides new opportunities for discovery for those who are willing to analyze it. Enter the data scientist.

 “Data Scientist” isn’t even listed as a career by the US Government’s Bureau of Labor Statistics yet, but it’s already been named the sexiest job of the 21st century by Harvard Business Review. With a growth pattern similar to that of data itself, it’s safe to say that data scientists are going to be in high demand. Among other skills, being a practitioner of data science requires analytical thinking, mathematical/statistical ability, a knack for communicating results to non-data people, and creativity. This combination of business acumen and technical skill isn’t easy to come by, and new graduate programs with an emphasis on data science seem to be cropping up daily to fill the gaps. One article from the New York Times recently asserted that the United States will need to increase the number of graduates with data science skills by as much as 60% to keep up with demand.  So, when you’re looking for new data scientists, where do you turn? To a generation who’s grown up with data science all around them – through Netflix recommendations, Google search results, and even at the movie theater à la Moneyball.

I was recently asked to participate in a “Job Hop Day” for a local elementary school. The idea was to expose 4-6 graders to different jobs that are available in the Mount Washington Valley in NH. It was a good opportunity to spend a fund day with elementary school students while exposing them to world of data science (and the idea that people actually get paid for doing it!). In preparing for our session, I realized that as thrilling as an hour-long lecture on data science might be for some, 10-year-olds probably wouldn’t be so interested. After ruling out a product demo and a slideshow, my coworkers and I thought about other ways to engage them. We decided the best approach for them to learn about being a data scientist was to do it themselves (in the guise of a game). 

When creating the game, we thought about some of the skills we wanted to reinforce, which were things like data mining, basic math, and the ability to make predictions. From there, we got creative – we wanted to pick a subject that kids would be interested in, and since vampires are on the brink of cliché, we settled on werewolves. The game we came up with was a variation of a Family Feud board that involved an initial data-mining phase to glean the characteristics of a werewolf.

To start, I gave the kids ten descriptions of people on color-coded index cards, five of which were designated as “werewolves” and five of which were “non-werewolves”. (Coming up with the descriptions was a good exercise for us as well, we tried to make  sure the clues weren’t too obvious, and had to plan them so that some characteristics were more popular than others. An example: three of the werewolves were vacationing in London this summer, but all five of them played some kind of sport). Each data scientist had a whiteboard to write down their descriptions as they went, and we stopped the “data mining” portion of the game once they all felt like they had come up with as many characteristics as they could. The Family Feud board I mentioned earlier had the ten characteristics listed in order of the number of times they came up, and the kids took turns guessing what was on the board.

Over the course of the day, three groups of students played the game, and all three groups seemed to really enjoy it. After we finished the game, we talked about the different uses of data and predictive modeling, covering examples spanning test scores to baseball. They were knee-deep in baseball season and pretty excited when I told them about a baseball scout’s presentation I saw at DRIVE, and how they used statistics to predict what might happen in each game. It was evident from our conversations that the kids had some knowledge of the amount of data around them and were interested in examining the world from a data-driven viewpoint. (I should probably mention here that the kids who chose to attend our session knew it would be math-related, so our sample was a bit biased.) Most of them had never heard of a data scientist or a statistical analyst before, but they were interested in the type of thinking we’d done. A few days later, a student’s mom told me that her son “loved the game” and “was so excited that it was an actual job that he could shoot for”.

Overall, our ad hoc approach to the data scientist experience seemed to go over well, but there’s always room for improvement. I’m interested in any ideas or experiences you guys have might regarding young data scientists, and would love to hear about them in the comments below. In the meantime, if you’ve had a sneaking suspicion about a certain neighbor around a full moon, or just want to have a little fun, I’d recommend trying out your own version of the game. 


-Caitlin Garrett is a Statistical Analyst at Rapid Insight

Tuesday, June 11, 2013

Campaign Pyramids: Brick by Brick

Recently, I got to chat with Chelsea Drake and James Dye, who are both Data Analysts at the College of William & Mary, about the work they've been doing on campaign pyramids. For a more in-depth look at the functions that their campaign pyramids serve, and their process for building them, be sure to check out their presentation at our user conference or stay tuned for a webinar rebroadcast in July

What is a campaign pyramid’s function in your office?

CD: Right now we’re using the pyramids as a donor-centric list of prospects. To give some background on the pyramids, we did a massive data mining project to determine where our donors’ interests were. The end result is a dynamic pyramid that updates as new gifts come in and as we get new information about where their philanthropic interest lie. We use them as accurate prospect lists.

JD: We had a bunch of people in our prospect pool and needed to know where their interests were. For example, if they’re into Athletics but graduated from the Business school, do we want to go after a split gift, or do we say that their primary interest is athletics, so they should be doing the ask? The pyramids help us decide which one we should try to raise money for. They also help to set goals for each department and each school. So we’ll set a goal and ask a question like ‘how many gifts do we need at different levels, and prospects do we need to make up that pool and reach our goal?’

How do you set the goals for each pyramid?

CD: We’re able create pyramids to test high, medium, and low goals to see which one is most feasible for each unit and each campaign overall.

JD: Each unit has three pyramids – they have a high goal, say 120M if 100M is the medium or mid-range goal, and a low goal, which might be something like 80M. The mid-range goal should be something they can accomplish without too much effort and the low goal is what we think they’d get if they only asked people we already knew. This allows us to see how much stretch we need to do and how many people we need to identify in order to hit certain monetary goals. The idea behind the project was to figure out where our prospect pool’s interests were and where we need to do work and identify new prospects to fill in gaps and holes.

What triggered your interest in campaign pyramids?

CD: We started last summer, our Assistant VP of Operations wanted to make sure we were being as donor-centric as possible. She knew we had some information on interests but that we didn’t have a reporting tool that identified which prospects should go with each interest. She knew I had an analytical background and that’s how she chose to bring the project to me.

JD: Previous pyramids had been done at the university level. For the college, we wanted to know who we had out there and how much money that would bring in with specific gift ratings. But we were also asking things like ‘How much can we get for athletics?’ and ‘Who are the people who are interested in athletics?’. That’s where it spawned into a donor-centric thing. We wanted to know what our donors’ interests were, what they’ve given to in the past, and on a program and unit based levels, who were the donors for each area.

Who builds the pyramids in your office? How did you decide that?

CD: James and I do, and that was decided based on our backgrounds. James has a programming and computer science background and I have a background in research and analytics.

JD: We’re the programming and analytic people in our office and were already working on data pools, but were brought onto this project based on our skillset. Within our department, we’re the ones who generally work with the data.

What’s your administration’s take on the pyramids?

JD: They like them a lot. It gives them an idea of monetary goals for each unit and school to stretch for and concrete lists of names. We can show them the people we’ve identified, and if we sum up all of things we have in a pyramid, we can see if the goal set for a department is realistic. It helps them to see who’s out there and who’s in our database. They also use it to present to a board of visitors in a slideshow on where we stand in a campaign and how our numbers are at any given point. They can tell how many people we’ve already identified and how many new people we need to identify to meet a goal.

What advice would you have for someone looking to undertake a project like this?

CD: One of the things that was really helpful for us as the project started was having a good relationship with IT to fine tune what the data files we get from them would look like. The key to doing this type of analysis effectively is to have the best data that you’re able to get from your system in the most consistent way possible. Also, you should absolutely plan out what your goals are for the project before you get started.

JD: You have to know which data points out there you can pull from and what would be relevant for your goal. Depending on the size of the school, you might want to focus on a single unit pyramid to narrow down the scope of what you want to do. You could start with a major gifts or annual fund pyramid, for example. It’s about first defining your question, then looking at the data to figure out which people to target and looking at the numbers to establish what your monetary goals should be. It helps to nail out a template of what you want the end result to look like before you start programming.  We knew what we wanted our end result to be, so then when we were programming forward, the question became ‘how do I fill out these blanks where these numbers should be?’. This way, when you start building, you’re able to visualize how to compile everything correctly according to your template. Also make sure that you have a good team working on the project, and that team members know what their role in the project is.

CD: Anytime you’re taking on a project like this, you want to have the ability to talk to the managers or executives of your department to make sure that your end result matches what they feel they need.


JD: Make sure it’s helpful for them. We’re numbers people. We can make a page full of numbers and look at it and understand it, but management might need something a little bit more nice looking. So the sheet we create for them outputs to a single page with colors so that when we turn it over to them, the information is logical and easy to read. It comes down to knowing your audience. 


Tuesday, June 4, 2013

Bookworming

Looking for a book to read this summer? We're proud to present our second annual list of Rapid Insight staff-recommended books for your perusal:

Walden by Henry David Thoreau (Mike Laracy, CEO)


When I first read this I started highlighting all of the sentences and paragraphs that were brilliant. When I realized that I was highlighting mostly everything I put away my highlighter. 
Naked Statistics by Charles Wheelan (Jon MacMillan, Data Analyst)


This book focuses on statistical analysis including inference, correlation, and regression analysis. As boring as that sounds to some, Charles Wheelan does an amazing job of keeping the book engaging and interesting. 
Inferno by Dan Brown (John Paiva, Account Management Team)


For any lovers of Florence, Italy, this is a definite must-read. While not reaching the level of some of his previous groups, Inferno is definitely a page turner. It’s not a scientific read but there are some great questions posted by the characters that force you to consider the basic math behind humanities’ survival or demise. 
Train Your Mind, Change Your Brain by Sharon Begley (Jeff Fleischer, Director of Client Operations)


Though it sounds like a self-help book, it’s actually a non-fiction work for the layman describing recent discoveries in the field of neuroscience. The author spoke at a Behavioral Healthcare conference I attended a few years ago. I liked the talk so much, I bought the book! Fascinating, yet easy read. 

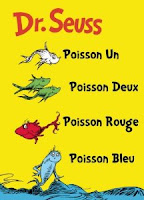
Poisson Un Poisson Deux Poisson Rouge Poisson Blue by Theodor Geisel (Scott Steesy, Chief Software Architect)

For some light mathematics.


To Sell is Human by Daniel H. Pink (Sheryl Kovalik, Director of Sales & Business Development – Higher Ed)

Being a big fan of sales, I was naturally excited to read a book that gave me excellent perspective on how access to information has changed the buyer/seller relationship; I also enjoyed Pink’s march through the history of sales and his advice on how to adapt for the new environment. But the best part of the book was the way in which the author helps one to see that all of us are sales folks in some way. If you’re in fundraising, admissions, technology, or service positions, there is something here for you – we’re all trying to sway others to our side!


The Signal and the Noise by Nate Silver (Caitlin Garrett, Statistical Analyst)

Named Amazon's #1 Best NonFiction Book for 2012, I'd say this book is proof positive that predictive analytics is going more mainstream. As a thought leader in the field, Silver's book is chalk full of examples of the practical applications of predictive modeling. A great read for the technical and non-technical alike.


Have you read anything good lately? We're always looking for recommendations - tell us about it in the comments.