Thursday, August 30, 2012

Veera's Been Updated!

If you haven't already, be sure to download the newest version of Veera, which was released this week. Updates include:

1. The ability to change the order of the jobs and other tabs

To switch the order of jobs or other tabs you have open in Veera, simply drag and drop the tabs at the top of the screen until they match the desired order. 

2. Easier way to view jobs and other tabs in separate windows with the introduction of a "tear off" feature

To view jobs or other tabs in a separate, un-docked window, simply drag the tab you'd like to view outside of the Veera window. 

3. Addition of editable job descriptions to the Workspace area


By double-clicking in the area highlighted in orange above, you can now add job descriptions to label your jobs. Here you can include information like how and why the jobs were created, which data files were used, and which outputs come from each job. This feature is also helpful when sharing jobs as a place to get a quick idea of what the job should accomplish. 

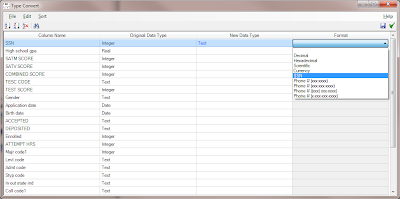
4. New ways to format data in the Convert node, including SSN and multiple phone number formats

To utilize the new formats in the Convert Column Data Type node, change the data type to 'Text', and select the appropriate new format from the drop-down menu. Included are four ways of expressing phone number, and an SSN format. See below. 


5. Can now add new categories to "Transpose By Values" list in Transpose node

You can now add new categories (ones that currently don't exist in your dataset) as "Transpose By Values" in anticipation of them being included in your dataset. To do so, select your "Transpose By" variable in the Transpose node, and click the Get Values button as you normally would. 


Next, click the button highlighted in orange above, which will open a new screen that allows you to add additional categories. 


Once in the new screen (shown above), click the green plus sign to add additional values to your "Transpose By" list. 


We hope you like the new features. My personal favorite so far is the tear-off feature to easily check out tabs in a new window (which is also great for side-by-side comparisons). If there is a new feature that you'd like to see in the next build of Veera, please email me and I'll make sure that your request finds its way to the right person. In the meantime, have fun exploring!

Friday, August 24, 2012

The Forgotten Tabs: Profiling Analysis


The final installment of the Forgotten Tabs Series is focused on the Profiling Analysis tab. The Profiling Analysis tab allows us to compare the two groups of a binary variable by generating an output of all of the variables in a dataset for which those two groups are significantly statistically different. Once in the tab, simply select the binary variable you’d like to profile, and you’ll get an output like this:


Here you can see that we are comparing students who enrolled at our institution to students who did not enroll to see what the major differences are between the two populations.

If your y-variable is binary, this tab provides great insight into how the populations that fall into the two possible categories of your y-variable differ. This also provides another way to look at your data. One common question I am asked is something along the lines of “Without knowing the scores, how do I know which variables I should be looking at?”, meaning that though the scores are helpful in decision making, sometimes knowing the differences between the variables that make up those scores can be just as helpful. The Profiling Analysis tab directs you to only those variables for which the two populations differ significantly.

One great use of the profiling tab in higher education is to compare the differences between graduates and non-graduates. The following illustrates what this analysis might look like: 


Using an output like this, we can see that students who graduated generally lived closer to campus, had a higher HS GPA, applied earlier, and had higher SAT Math scores than non-graduates. Highlighting these differences and placing an average value on each variable for both graduates and non-graduates allows us greater insights into the differences between these two populations. The Profiling Analysis tab is a great resource whenever you want to compare two populations to see how and where they differ statistically. 

-Caitlin Garrett, Statistical Analyst at Rapid Insight

Thursday, August 16, 2012

The Forgotten Tabs: Correlation Analysis


Next up in the ForgottenTabs series is the Correlation Analysis tab. The Correlation Analysis tab provides a correlation coefficient for any two variables in our dataset. To get these values, simply check the boxes next to the variables you’re interested in correlating. The resulting correlation coefficient can be either positive or negative, and generally if the value is greater than +/- .1, we say that those two variables are significantly correlated. Knowing how different variables are correlated can allow us to understand variable selection and create more accurate models. 

Sometimes a high correlation value can explain why a variable may not have made its way into a final model if a similar variable did. An example of this is the correlation between the variables “SAT Math”, “SAT Verbal”, and “HS GPA”. As indicators of student success, you might guess that these variables have a positive correlation – so, you would expect that a student with a relatively high HS GPA will, in turn also have relatively high SAT scores, and vice versa. If we were to build a model that utilized these variables, however, we would typically get something like the following: 


Here we see an “SAT Math” variable in our final model, but “SAT Verbal” and “HS GPA” are nowhere to be found. 


Looking at these variables in the Correlation Analysis tab will confirm our earlier guess that the variables are correlated, which in turn explains why all three are not included in the model: 


Note that each correlation coefficient is well above the general .1 threshold of significant correlation, meaning that these variables are, in fact, strongly correlated. This correlation is accounted for when we build our predictive models, so that if a change in one generally brings about a change in another, Analytics will pick the stronger predictor of the two and leave the other out.

Another thing to check for in a correlation analysis is for perfect predictors. If a variable pair has a correlation equal to one, you’ll know that those variables are perfect predictors of each other. Some common examples are retention and attrition, and housing deposit and enrollment. These things are perfect predictors of each other because retention is the opposite of attrition, and you typically need to enroll to make a housing deposit. Using the Correlation Analysis tab can tell you if you do have any perfect predictors; if you do, you should be sure to take one of the variables out of the analysis. 

-Caitlin Garrett, Statistical Analyst at Rapid Insight

Friday, August 3, 2012

"Job Security"


I think it’s a universally acknowledged fact that most people don’t back up their files as often as they should. That said, I recently learned how to back up my files in Veera, and it was painless. In fact, the whole process took less than a minute. If the thought of losing your jobs or having to reset all of your connections frightens you as much as it does me, you should follow these easy steps to back up all of your Veera jobs and connections:

1. Open Veera
2. Go to File -> Database -> Backup.


3. In the open window, navigate to the place where you’d like to save your Veera Backup File.
4. Celebrate! You’re all backed up.


If, in the event of a data emergency, you ever need to access these backed-up files, you can do so by going to File -> Database -> Restore. This will restore both your connections and your jobs. Choosing the Recover Lost Jobs option will allow you to recover any jobs that may have been corrupted along the way without affecting your connections. 

-Caitlin Garrett, Statistical Analyst at Rapid Insight